
Russell 2000 Trading Trends: What Small Caps Did in 2026
Learn what the Russell 2000 is, how small-cap stocks moved in 2026, and why interest rates matter. A simple beginner’s guide to Russell 2000 trading trends.
If you’ve heard the “Russell 2000” on the news and wondered what it means, this guide is for you. You’ll learn what the index tracks, how small-cap stocks moved in 2026, and why interest rates matter so much to them. We’ll also look at how to read market headlines and what the risks are.
What Is the Russell 2000?
The Russell 2000 is a stock market index. An index is a list of companies whose combined performance is tracked as one number, so you can see how a group of stocks is doing without checking each one.
This index follows about 2,000 smaller US companies and is maintained by FTSE Russell. These are called small-cap stocks. “Cap” is short for market capitalization, which is a company’s total value on the stock market (share price multiplied by the number of shares).
Many of these businesses are regional banks, local manufacturers, healthcare firms, and growing tech companies. They depend more on the US economy than global giants do. That is why the Russell 2000 index is often seen as a mood gauge for the domestic economy.
How the Russell 2000 Has Performed in 2026
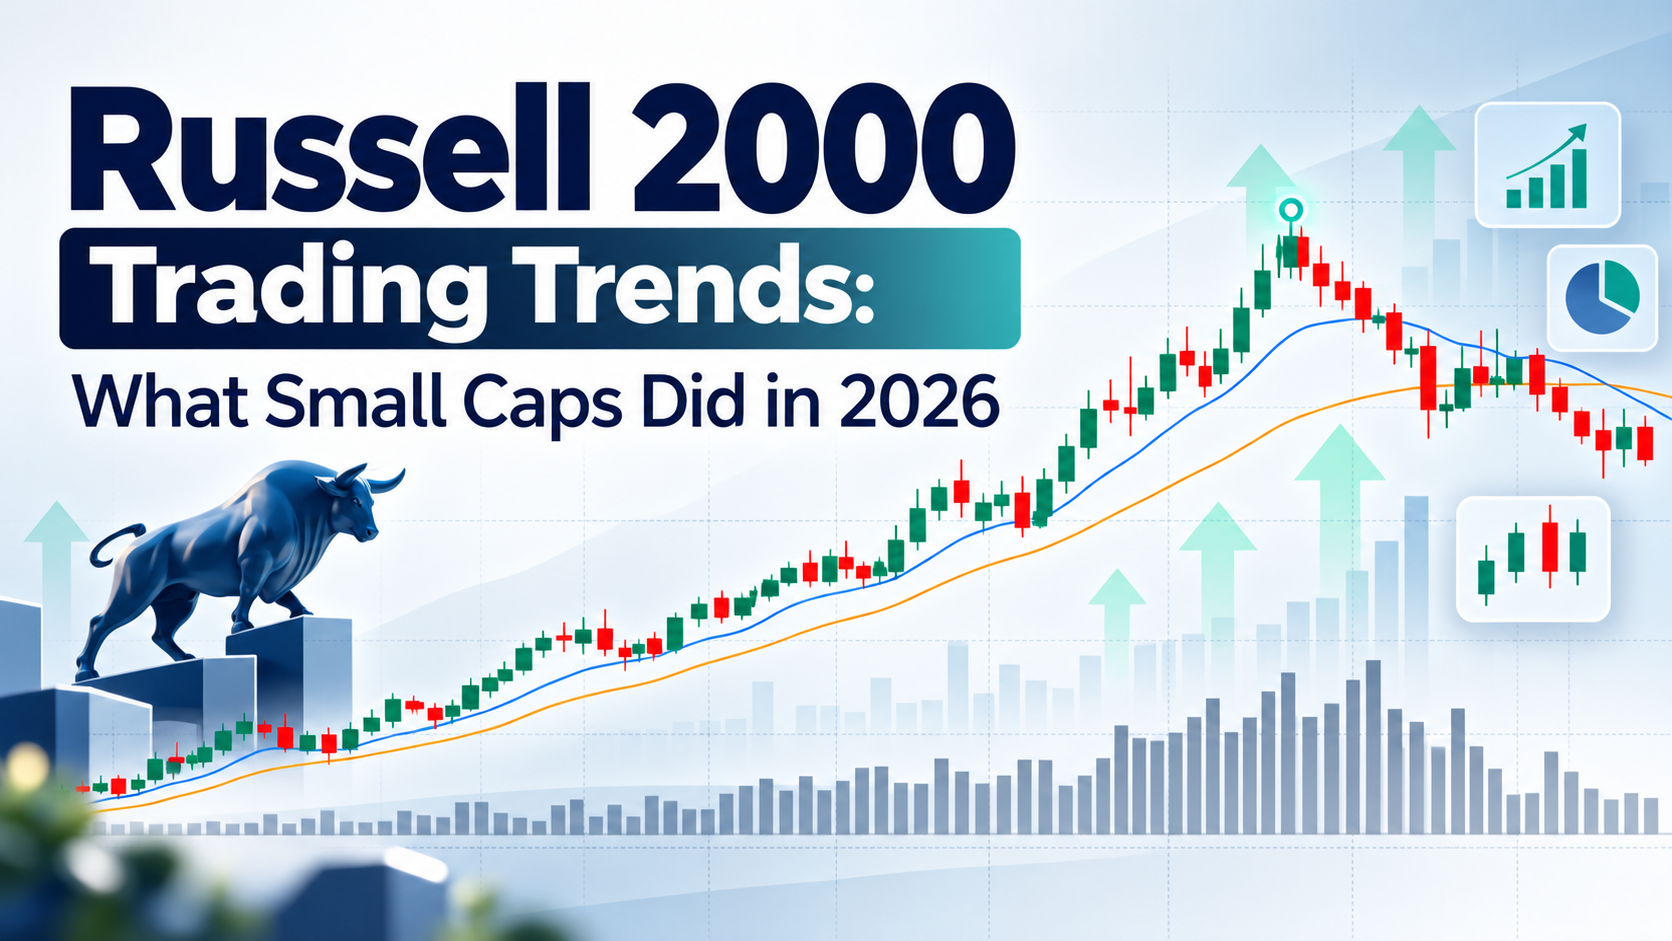
Russell 2000 trading trends in 2026 follow a clear arc: a strong run to a record, then a pullback.
- August 12, 2026: The index closed at a record 3,045.48.
- Third quarter 2026: The quarter’s high was about 3,068.415. A “high” is the top level reached during a period, which can differ slightly from a day’s closing value.
- October 8, 2026: The index closed at 2,794.128, roughly 9% below the third-quarter high.
A drop of about 9% over a few weeks is noticeable, but it is not unusual for small-cap stocks. This part of the market is known for bigger swings than the large-company indexes.
Why Small Caps Have Pulled Back
Interest rates are one of the biggest drivers of recent small-cap market trends. Expectations about what the Federal Reserve might do at its October and December meetings have been an important factor.
The Federal Reserve, often called “the Fed,” is the US central bank. It sets a benchmark interest rate that influences what banks charge for loans across the economy. When people expect the Fed to raise rates, markets often start adjusting before any decision is made.
Why smaller companies feel rates more
Small companies are generally more sensitive to borrowing costs than big ones:
- They rely more on loans. Large corporations have many ways to raise money. Smaller firms often depend on bank loans and credit lines, so higher rates raise their monthly costs.
- Their debt may reset sooner. Some small-business borrowing has a variable rate, meaning the interest changes when market rates change.
- They have less cushion. A company with thinner profits has less room to absorb higher costs.
- Growth costs money. Many small firms are expanding, and expansion usually needs funding.
Higher rates can also make safer options, like savings accounts and government bonds, look more appealing next to riskier stocks. On top of that, general economic worries can weigh on this group. Smaller firms sell mostly to US customers, so signs of slowing spending can show up quickly in their share prices.
Russell 2000 vs S&P 500 vs Nasdaq
People often compare the Russell 2000 with two other well-known benchmarks. They measure different slices of the market, so they can move in different directions on the same day.
Russell 2000
This index follows about 2,000 smaller US companies. Because these firms are smaller and depend more on the US economy, the index often reacts quickly to changes in interest rates and economic news.
S&P 500
The S&P 500 tracks about 500 large US companies and is maintained by S&P Dow Jones Indices. These are household names with customers around the world, so the index tends to move more smoothly than small-cap stocks.
Nasdaq Composite
The Nasdaq Composite covers companies listed on the Nasdaq exchange, and a large share of them are technology firms. Its movements are often tied to how people feel about tech and growth companies.
No index is “better” than another. Each answers a different question, and reading them together gives a fuller picture.
How to Read Russell 2000 News as a Beginner
Market headlines can sound complicated, but a few habits make them easier to follow.
Look at the time period. A one-day move says very little. A change over several weeks or months shows more of the real direction.
Check the starting point. A “9% drop” always means a drop from a specific high. Ask which date the comparison starts from, like the August to October 2026 example above.
Compare with other indexes. If small caps fall while large companies hold steady, the cause is probably something that affects small firms more, like borrowing costs.
Separate the index from single companies. The Russell 2000 is an average of about 2,000 businesses. Some can rise while the index as a whole falls.
Common Misunderstandings About Small-Cap Stocks
“A falling index means the companies are failing.” Not necessarily. Prices often move because of expectations about interest rates or the economy, even when most businesses are running normally.
“Small caps and big caps always move together.” They often don’t. Differences in size, debt, and customer base can make the two groups react differently to the same news.
“A record high means a drop is coming.” A record only shows where the index closed on one day. It says nothing certain about what happens next.
“Small-cap means unknown or tiny.” The label refers to a company’s market value compared with larger firms. Many of these businesses are well established.
What to Watch Next
Nobody can say where the index will go from here. This is a list of events that market watchers commonly follow, not a forecast.
- Federal Reserve meetings. The October and December meetings are in focus. The wording of the Fed’s statements can shift expectations as much as the decision itself.
- Inflation data. Inflation measures how fast prices are rising. Reports like the Consumer Price Index (CPI) can influence what people expect the Fed to do.
- Jobs reports. Monthly employment data shows whether the economy is adding or losing jobs, which matters for small businesses.
- Company earnings. Quarterly results show how real businesses are handling higher costs and customer demand.
Risks of Small-Cap Investing
Volatility. This means how sharply prices move up and down. Small-cap stocks are usually more volatile than large-company stocks, so gains and losses can arrive faster.Price swings are not unique to stocks. If you’re curious how another fast-moving market compares, here’s a guide to crypto trading risks in the US.
Lower liquidity. Liquidity describes how easily a stock can be traded without moving its price. Smaller companies often have fewer shares changing hands each day, so prices can jump more on modest trading activity.
Economic sensitivity. These firms depend heavily on the domestic economy. A slowdown, tighter lending, or higher borrowing costs can hit them harder than global giants.
Company-specific risk. Smaller businesses often have shorter track records and less financial padding, so one setback can matter more.
FAQ
What does the Russell 2000 measure?
It measures the performance of about 2,000 smaller US companies and is widely used as a benchmark for the US small-cap market.
Who maintains the Russell 2000 index?
FTSE Russell, an index provider, maintains it and updates its membership on a regular schedule.
Why do interest rates affect small caps so much?
Smaller companies tend to rely more on loans and credit, so higher borrowing costs can cut into their profits more directly than they would for large firms.
Is the Russell 2000 the same as the stock market?
No. It covers only small companies. Other indexes, like the S&P 500, track larger firms, and each can tell a different story on the same day.
Final Thoughts
The Russell 2000 reached a record close of 3,045.48 on August 12, 2026, then eased to 2,794.128 by October 8, about 9% below its third-quarter high. Interest-rate expectations around the Fed’s October and December meetings have been a big part of that move. Following Russell 2000 trading trends helps everyday readers understand how smaller US businesses are doing.
Written by
EmmaYou might also like

Cryptocurrency Trading in the US Market Trends, Risks and Key Insights
This beginner-friendly guide explains how US crypto trading works in 2026. It covers market trends, US regulations, crypto taxes, popular exchanges, and the main risks, with practical tips for trading more safely.

Why Gold Trading Is Getting More Attention From US Traders
Gold trading is getting more attention from US traders as interest rates, the dollar, inflation data, and gold futures shape the market. Here is how these factors work, and what risks come with trading gold.
Why AMD Stock Is Moving Higher and What Comes Next
AMD stock crossed a $1 trillion market value in September after record Data Center growth and a new $8.2 billion acquisition. Here is what is behind the rally, the numbers that matter, and the risks to keep in mind.
US Stocks Near Record Highs: Why Traders Are Nervous
US stocks are near record highs as traders watch the Fed, Treasury yields, inflation, and options expiration for signs of a market move.
Comments (0)
Be the first to comment.